In the vibrant symphony of mathematics, where equations dance and numbers sing, lies a captivating quartet known as phase shift, amplitude, frequency, and period. These fundamental concepts play a crucial role in understanding the behavior of waves, those graceful undulations that permeate the physical world and beyond.
Imagine a rhythmic ocean wave, gracefully rising and falling as it crashes against the shore. Its amplitude determines the majestic height of its crest, and how far it deviates from the calm ocean’s surface. Think of it as the volume knob in a musical wave, dictating the loudness of its rhythmic roar.
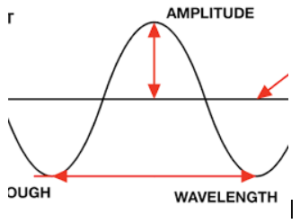
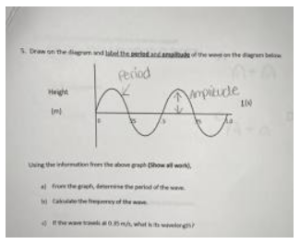
wave labeled with Amplitude.
Next, consider the wave’s frequency, and the tempo of its dance. It tells us how often the wave repeats its cycle, and how many crests and troughs roll by in a given time. Picture a fast-paced drumbeat compared to the slow, deliberate rhythm of a church bell – their frequencies paint contrasting sonic landscapes.
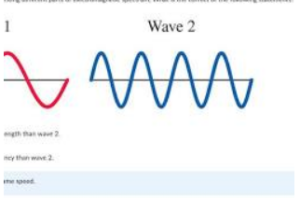
two waves, one with high frequency and one with low frequency
But wait, there’s more! Not all waves begin their waltz at the same point. This is where phase shift steps in, acting like a mischievous choreographer. It dictates how far we need to “skip” along the wave’s rhythm before reaching its peak. Imagine two identical waves starting their dance at different moments, creating a mesmerizing visual interplay.
Finally, the period joins the ensemble, acting as the metronome of the wave’s performance. It represents the total time it takes for the wave to complete one full cycle, crest to trough and back again. Think of it as the duration of a single musical note, the time between its birth and its graceful fade.
These four concepts, intertwined like the notes in a melody, paint a complete picture of a wave’s behavior. By understanding their interplay, we unlock the secrets of sound, light, and countless other phenomena governed by the rhythmic dance of waves. So, embark on this mathematical adventure, and prepare to be mesmerized by the captivating harmony of phase shift, amplitude, frequency, and period!
What Makes a Periodic Function: Amplitude, Period, Phase Shift?
In the realm of mathematics, periodic functions are like enchanting dancers, gracefully repeating their patterns over and over again. They captivate with their rhythmic movements, and the secrets of their choreography lie within three key concepts: amplitude, period, and phase shift.
Here’s how these characteristics shape the dance of periodic functions:
- Amplitude: The Height of Each Leap
- Measures the maximum displacement of the function from its central position, or midline.
- Visually, it determines the vertical “reach” of the function’s peaks and valleys.
- Imagine a vibrant dancer soaring high above the stage before gracefully descending—that’s amplitude in action.
- Period: The Rhythm of the Dance
- Represents the horizontal distance between consecutive peaks (or any two corresponding points) of the function.
- Measures how long it takes for the function to complete one full cycle of its pattern.
- Like a drummer setting the tempo, the period dictates the pace of the function’s repetition.
- Phase Shift: The Choreographer’s Twist
- Determines how far the function’s pattern is horizontally shifted or translated.
- Imagine two identical dancers starting their routines at slightly different moments—that’s a phase shift at play.
- It controls the starting point of the function’s cycle, adding a unique twist to its choreography.
Together, these three characteristics orchestrate the captivating performance of periodic functions. By understanding their interplay, we can describe, predict, and visualize the behavior of various phenomena in nature and technology, such as:
- Sound waves: The amplitude determines loudness, the frequency dictates pitch, and the phase shift creates different tones.
- Light waves: Amplitude influences brightness, frequency determines color, and phase shift enables wave interference.
- Electrical signals: Amplitude controls voltage, frequency determines the signal type (e.g., AC vs. DC), and phase shift is crucial in signal synchronization.
How to Find Attributes of a Sinusoidal Function?
Here’s a guide to uncovering the attributes of a sinusoidal function, assuming a general form of y = A sin(Bx + C) + D:
- Amplitude (A):
- The absolute value of the coefficient of the sine term (A).
- Measures the vertical distance between the midline (y = D) and the peaks or troughs of the graph.
- Period (P):
- Calculated as 2π / B.
- Represents the horizontal distance between consecutive peaks (or any two corresponding points) of the graph.
- Phase Shift (PS):
- Calculated as -C / B.
- Indicates the horizontal shift of the graph relative to the standard sine wave.
- A positive phase shift moves the graph to the left, while a negative phase shift moves it to the right.
- Vertical Shift (D):
- Represented by the constant term (D).
- Shifts the entire graph vertically.
- A positive vertical shift moves the graph up, while a negative vertical shift moves it down.
Example:
Consider the function y = 3 sin(2x – π) + 1.
- Amplitude = 3 (height of peaks and troughs)
- Period = 2π / 2 = π (distance between consecutive peaks)
- Phase Shift = -(-π) / 2 = π/2 (graph shifted π/2 units to the right)
- Vertical Shift = 1 (graph shifted 1 unit up)
Key Points:
- The sine wave is the most basic sinusoidal function.
- Other sinusoidal functions, such as cosine and tangent, have similar attributes.
- Graphing the function is often helpful for visualizing these attributes.
- Understanding these attributes is essential for many applications in physics, engineering, and other fields.
How to Find the Amplitude?
There are two main ways to find the amplitude of a sinusoidal function:
- From the Equation:
- Locate the absolute value of the coefficient of the sine or cosine term. This coefficient represents the amplitude directly.
- For example, in the function y = 3 sin(x) + 2, the amplitude is 3 (absolute value of 3).
- From the Graph:
- Identify the peaks (highest points) or troughs (lowest points) of the graph.
- Measure the vertical distance between the midline (the horizontal line in the middle of the graph) and a peak or trough. This distance equals the amplitude.
- Remember, take the absolute value if the function dips below the midline.
Here are some additional tips:
- If the function includes a vertical shift (constant term added at the end), make sure to measure the distance from the shifted midline, not the horizontal axis.
- Be consistent in your measurement units (pixels, centimeters, etc.) when finding the amplitude from the graph.
- If you’re unsure about the type of sinusoidal function (sine, cosine, etc.), analyzing the equation’s period (2π divided by the coefficient before x) can give you a clue.
How to Find the Period?
Finding the period of a sinusoidal function is a breeze once you know the trick! Here are two ways to do it:
- From the Equation:
- Look for the coefficient multiplying the variable within the parentheses (usually x). This coefficient is represented by the letter B in the general form of a sinusoidal function: y = A sin(Bx + C) + D.
- Divide 2π by this coefficient B. This calculation gives you the period of the function.
- For example, in the function y = 2 sin(4x + π) + 1, B = 4. Therefore, the period is 2π / 4 = π/2.
- From the Graph:
- Locate any two consecutive peaks (or any two corresponding points) on the graph.
- Measure the horizontal distance between these points. This distance represents the period.
- Repeat the process if you’re unsure about the correct points. Remember, consecutive peaks or troughs have the same period.
Additional Tips:
- Make sure your units are consistent when measuring the distance on the graph (pixels, centimeters, etc.).
- The period doesn’t depend on the amplitude (distance from the midline to the peak) or the phase shift (horizontal shift of the graph).
- Understanding the period can help you analyze other attributes of the function, like its frequency (inversely proportional to the period).
How to Find the Frequency?
Here’s how to find the frequency of a sinusoidal function:
- From the Period:
- Recall that frequency and period are inversely related.
- Simply calculate the reciprocal of the period to find the frequency.
- Mathematically, frequency (f) = 1 / period (T).
- From the Equation:
- Locate the coefficient of the variable within the parentheses (usually x).
- Divide 2π by this coefficient and then divide that result by 2π again.
- Alternatively, divide 1 by (2π times the coefficient).
Example:
Consider the function y = 3 sin(4x) + 1.
- Period (T) = 2π / 4 = π/2.
- Frequency (f) = 1 / (π/2) = 2/π.
Key Points:
- Frequency measures the number of complete cycles (oscillations) the function completes per unit of time.
- Common units of frequency include hertz (Hz), cycles per second, or radians per second.
- The frequency of a sinusoidal function remains constant, even if the amplitude, phase shift, or vertical shift changes.
Additional Tips:
- Use consistent units when calculating frequency.
- Visualizing the graph can help solidify the relationship between frequency and period.
- Frequency is a fundamental concept in physics, engineering, and other fields that deal with waves and periodic phenomena.
How to Find the Vertical Shift?
Here’s how to find the vertical shift of a sinusoidal function:
From the Equation:
- Look for the constant term added at the end of the function’s equation, not within any parentheses.
- This constant term directly represents the vertical shift.
- If the constant term is positive, the graph is shifted upward.
- If the constant term is negative, the graph is shifted downward.
From the Graph:
- Identify the midline of the graph, which is the horizontal line that evenly divides the peaks and troughs.
- Measure the vertical distance between the midline and the horizontal axis (x-axis).
- This distance equals the vertical shift.
Example:
Consider the function y = 4 cos(2x) – 3.
- Vertical shift = -3 (graph shifted 3 units downward)
Key Points:
- Vertical shift doesn’t affect the amplitude, period, or frequency of a sinusoidal function.
- It merely repositions the entire graph vertically.
- It’s often used to adjust the function to fit specific data or to represent real-world phenomena.
Additional Tips:
- Be consistent in your measurement units (pixels, centimeters, etc.) when finding the vertical shift from the graph.
- Consider graphing the function using a graphing calculator or software to visualize the vertical shift.
- Understanding vertical shift is valuable in applications like modeling wave patterns, sound signals, and other periodic phenomena.
How to Find the Phase Shift?
Here’s how to find the phase shift of a sinusoidal function:
- From the Equation:
- Locate the coefficient of the variable within the parentheses (usually x), denoted as B.
- Locate the constant term added within the parentheses, denoted as C.
- Calculate the phase shift as -C/B.
- A positive phase shift moves the graph to the left, while a negative phase shift moves it to the right.
- From the Graph:
- Identify the closest peak or trough to the y-axis (at x = 0).
- Measure the horizontal distance between this point and the y-axis.
- This distance, with the appropriate sign, represents the phase shift.
Example:
Consider the function y = 2 sin(3x – π) + 1.
- Phase shift = -(-π)/3 = π/3 (graph shifted π/3 units to the right)
Key Points:
- Phase shift indicates how far the graph of the function is horizontally shifted from its “standard” position.
- It doesn’t affect the amplitude, period, or frequency of the function.
- It’s often used to model real-world phenomena where waves or oscillations start at different points in time.
Additional Tips:
- Be consistent in your measurement units (pixels, centimeters, etc.) when finding the phase shift from the graph.
- Graphing the function using a graphing calculator or software can help visualize the phase shift.
- Understanding phase shift is essential in applications like signal processing, wave mechanics, and other areas involving periodic behavior.
To Sum Up:
We’ve embarked on a captivating journey through the realm of periodic functions, specifically focusing on sinusoidal waves. Along the way, we unearthed the secrets hidden within their graceful oscillations, learning how to unveil their amplitude, period, phase shift, and vertical shift.
Amplitude: Like the majestic peaks of a mountain range, it dictates the function’s grandiosity, the distance it reaches from its central position.
Period: The tempo of the dance, how often the function completes its full cycle, and a rhythmic heartbeat that governs its repetition.
Phase Shift: The choreographer’s twist, a horizontal nudge that sets the starting point of the function’s performance, adds a unique flavor to its rhythm.
Vertical Shift: An elevator ride for the entire graph, moving it up or down, adjusting its position on the stage of the coordinate plane.
By understanding these attributes, we gain the power to decipher the language of waves, predicting their behavior and unlocking insights into various phenomena in the world around us. From the rhythmic beats of sound waves to the vibrant dance of light, these concepts act as a key to understanding the symphony of nature and technology.
So, as you continue your exploration of the mathematical landscape, remember the power of these attributes. Let them guide you in unraveling the mysteries of periodic functions, appreciating their mesmerizing patterns, and ultimately, comprehending the rhythmic beauty of the world around us.
Follow Math Solver Online for more solutions